How many fleets make the claim “safety is #1”? Probably every fleet! After all, it’s difficult to find a fleet or a manager that turns a blind eye to safety. In this post, we will study how to change poor driver behaviour with a safety engagement tool such as ZenScore.
ZenScore
ZenScore is a driver engagement tool that helps change poor driver behaviour. Fleets use the program to create and score multiple areas such as safety, productivity, and maintenance.
ZenScore helps change poor driver behaviour by using 3 principles:
1. Firstly, ZenScore ranks drivers from custom rules.
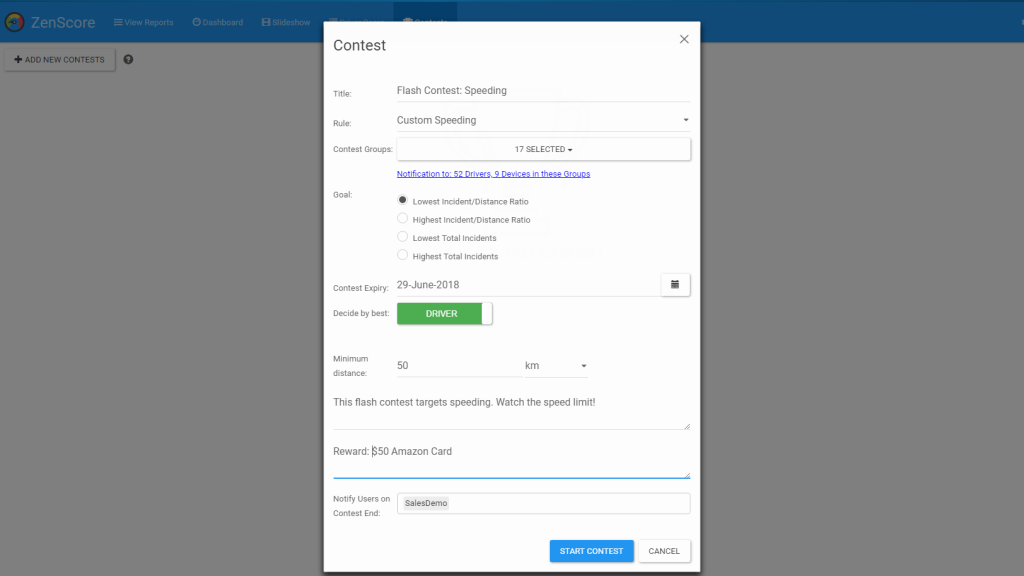
2. Secondly, ZenScore runs contests to engage drivers.
3. Thirdly, ZenScore creates reports to summarize performance.
Let’s dive deeper into the 3 principles.
1 – Ranking Drivers
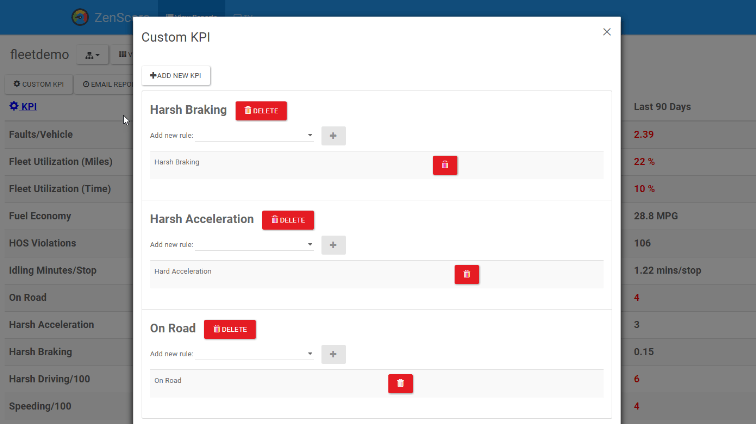
ZenScore helps businesses rank drivers by creating measurements and scoring drivers.
Create Measurements
Firstly, fleets create measurements around specific areas. For instance, a ZenScore user created measurements to target safety, fuel, and maintenance. Some examples from their database include:
- Safety measurements: speeding, harsh braking, harsh cornering, and seatbelt usage.
- Fuel measurements: fuel consumption, and idling.
- Maintenance measurements: common faults, repair job completion, and inactive devices.
Scoring and Ranking
After creating measurements, the next step is scoring drivers. The process is similar to a teacher marking their students. Just like how teachers collect grades for report cards, ZenScore collects live vehicle data to rank performance.
In the end, ZenScore creates two ranks. First, ZenScore creates an aggregate fleet report that displays how the entire fleet performed to each measurement. Second, ZenScore ranks individual drivers in each category and displays the best and worst performers.
2 – Running Contests
Humans & Competition
Humans are driven by competition. According to a Harvard study, 50% of humans prefer earning $50K a year versus an average of $25K over earning $100K versus an average of $200K. Ultimately, many humans want to perform better than their peers.
Why do people compete? People compete over extrinsic rewards and intrinsic rewards. Extrinsic rewards means a physical reward such as bonuses or raises. On the other side, intrinsic rewards are “feel good” rewards such as recognition or bragging rights.
Creating Contests on ZenScore
ZenScore helps fleet change bad driver behaviours by running contests to provide extrinsic and intrinsic rewards. The process is straightforward.
First, users create a new contest by entering measurements from Principle 1. Then, users can list winner rewards and contest end date. Finally, ZenScore does the rest by measuring data and finding a winner.
3 – Running Reports
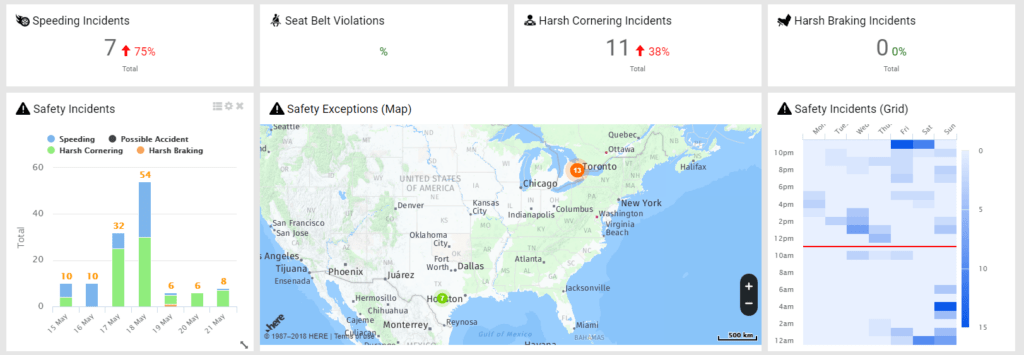
Thirdly, ZenScore creates a report dashboard. What is a report dashboard? A report dashboard is similar to someone’s Favourite Pages on their web browser. It’s a homepage display that shows off the most important reports.
We took a look at a sample dashboard, which included the following 3 reports:
Productivity Reports
Purpose: Ensure all assets are used.
Productivity reports collects usage patterns such as driving time and utilization. As a result, it helps fleets find underused assets instead of buying new assets.
Heat Map
Purpose: Identify riskiest areas.
Heat maps overlap safety rules with maps. These maps help managers guide their safety policies. For instance, one company noticed that there were low safety compliance rates in school zones. This prompted the company to create school compliance rankings to change poor driver behaviour in school zones.
Compliance Reports
Purpose: Reduce compliance fines.
ELD compliance season may be over but that doesn’t mean HOS compliance is over! HOS tickets are costly. With Compliance Reports, companies can see overall company compliance and identify repeat individual offenders.


